📘 Expense Tracker
Expense Wisely – Where Your Money Stops Playing Hide and Seek!
📌 Overview
Expense Tracker is a mobile-first financial management application designed to help users easily track their daily and monthly expenses. The application emphasizes a user-friendly UI/UX tailored specifically for smartphones, allowing seamless personal finance management on the go.
This application leverages Angular as the frontend framework and Tailwind CSS for responsive and modern UI styling. All user data is stored in LocalStorage, making the app lightweight and independent of backend dependencies.
⬇️ Download APK | 🌐 Live Demo | 🔗 GitHub | 📄 Code Documentation
🧰 Tech Stack
| Technology | Purpose |
|---|---|
| Angular | Frontend application logic |
| Tailwind CSS | Styling and responsive UI |
| LocalStorage | Persistent data storage |
| Spring Boot | Backend api logic |
📱 Features & Functionality
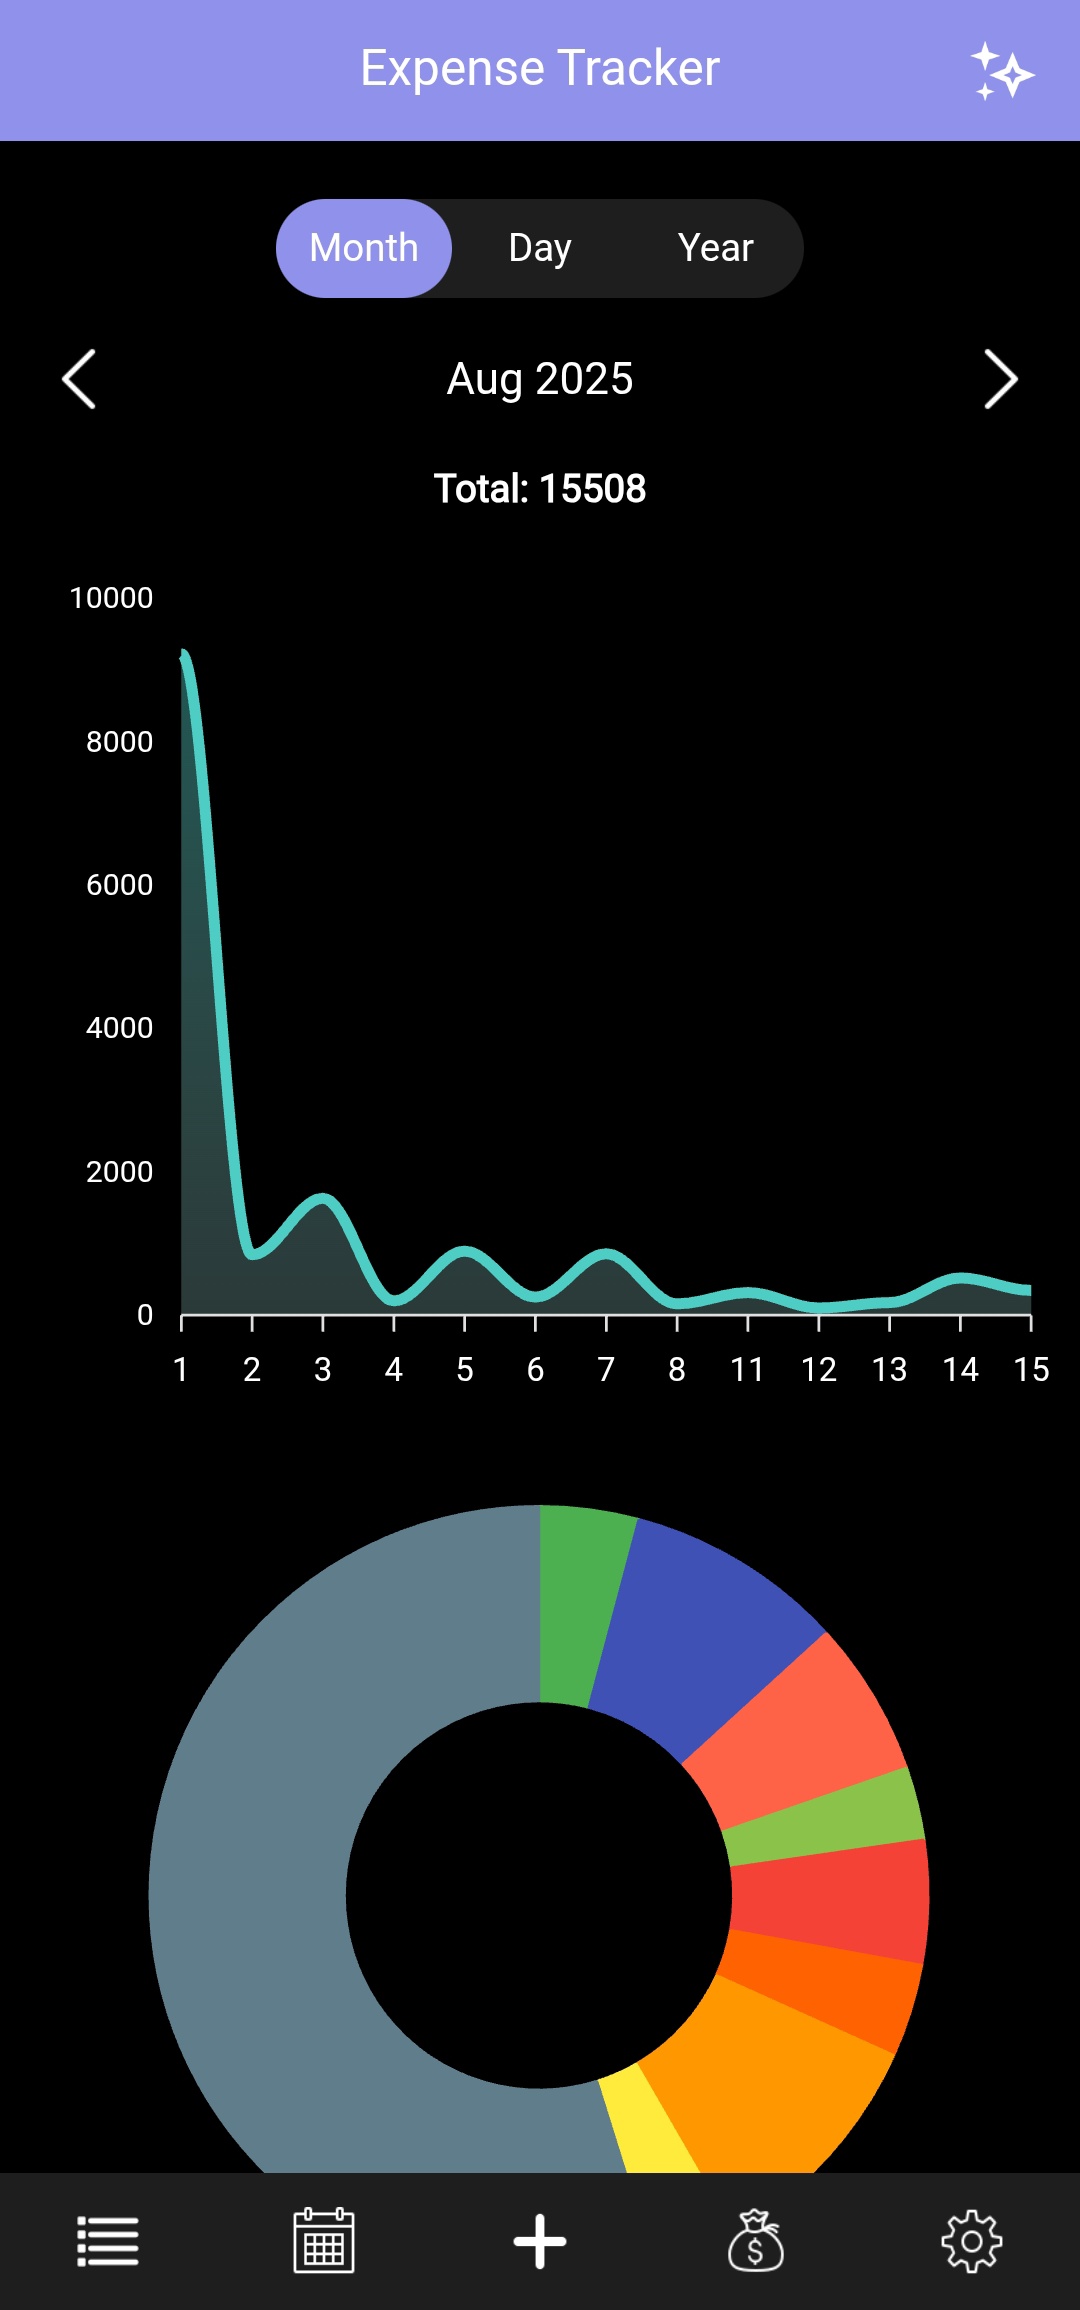
1. Dashboard View
- Upon launch, users are greeted with two interactive graphs:
- Expense Graph:
- Displays a line graph representing user expenses over time.
- Supports multiple time-based views:
- Daily – View expenses for individual days.
- Monthly – View month-wise expense distribution.
- Yearly – View yearly expense trends.
- Includes a graph representation toggle:
- Discrete (discrete values) – Shows period-wise expense values.
- Cumulative – Shows a running total of expenses over time, useful for understanding overall spending growth.
- Graph updates dynamically based on the selected time range and graph mode.
- Category-wise Pie Chart: Visualizes how the expenses are distributed across different categories (e.g., Food, Travel, Shopping).
- Expense Graph:
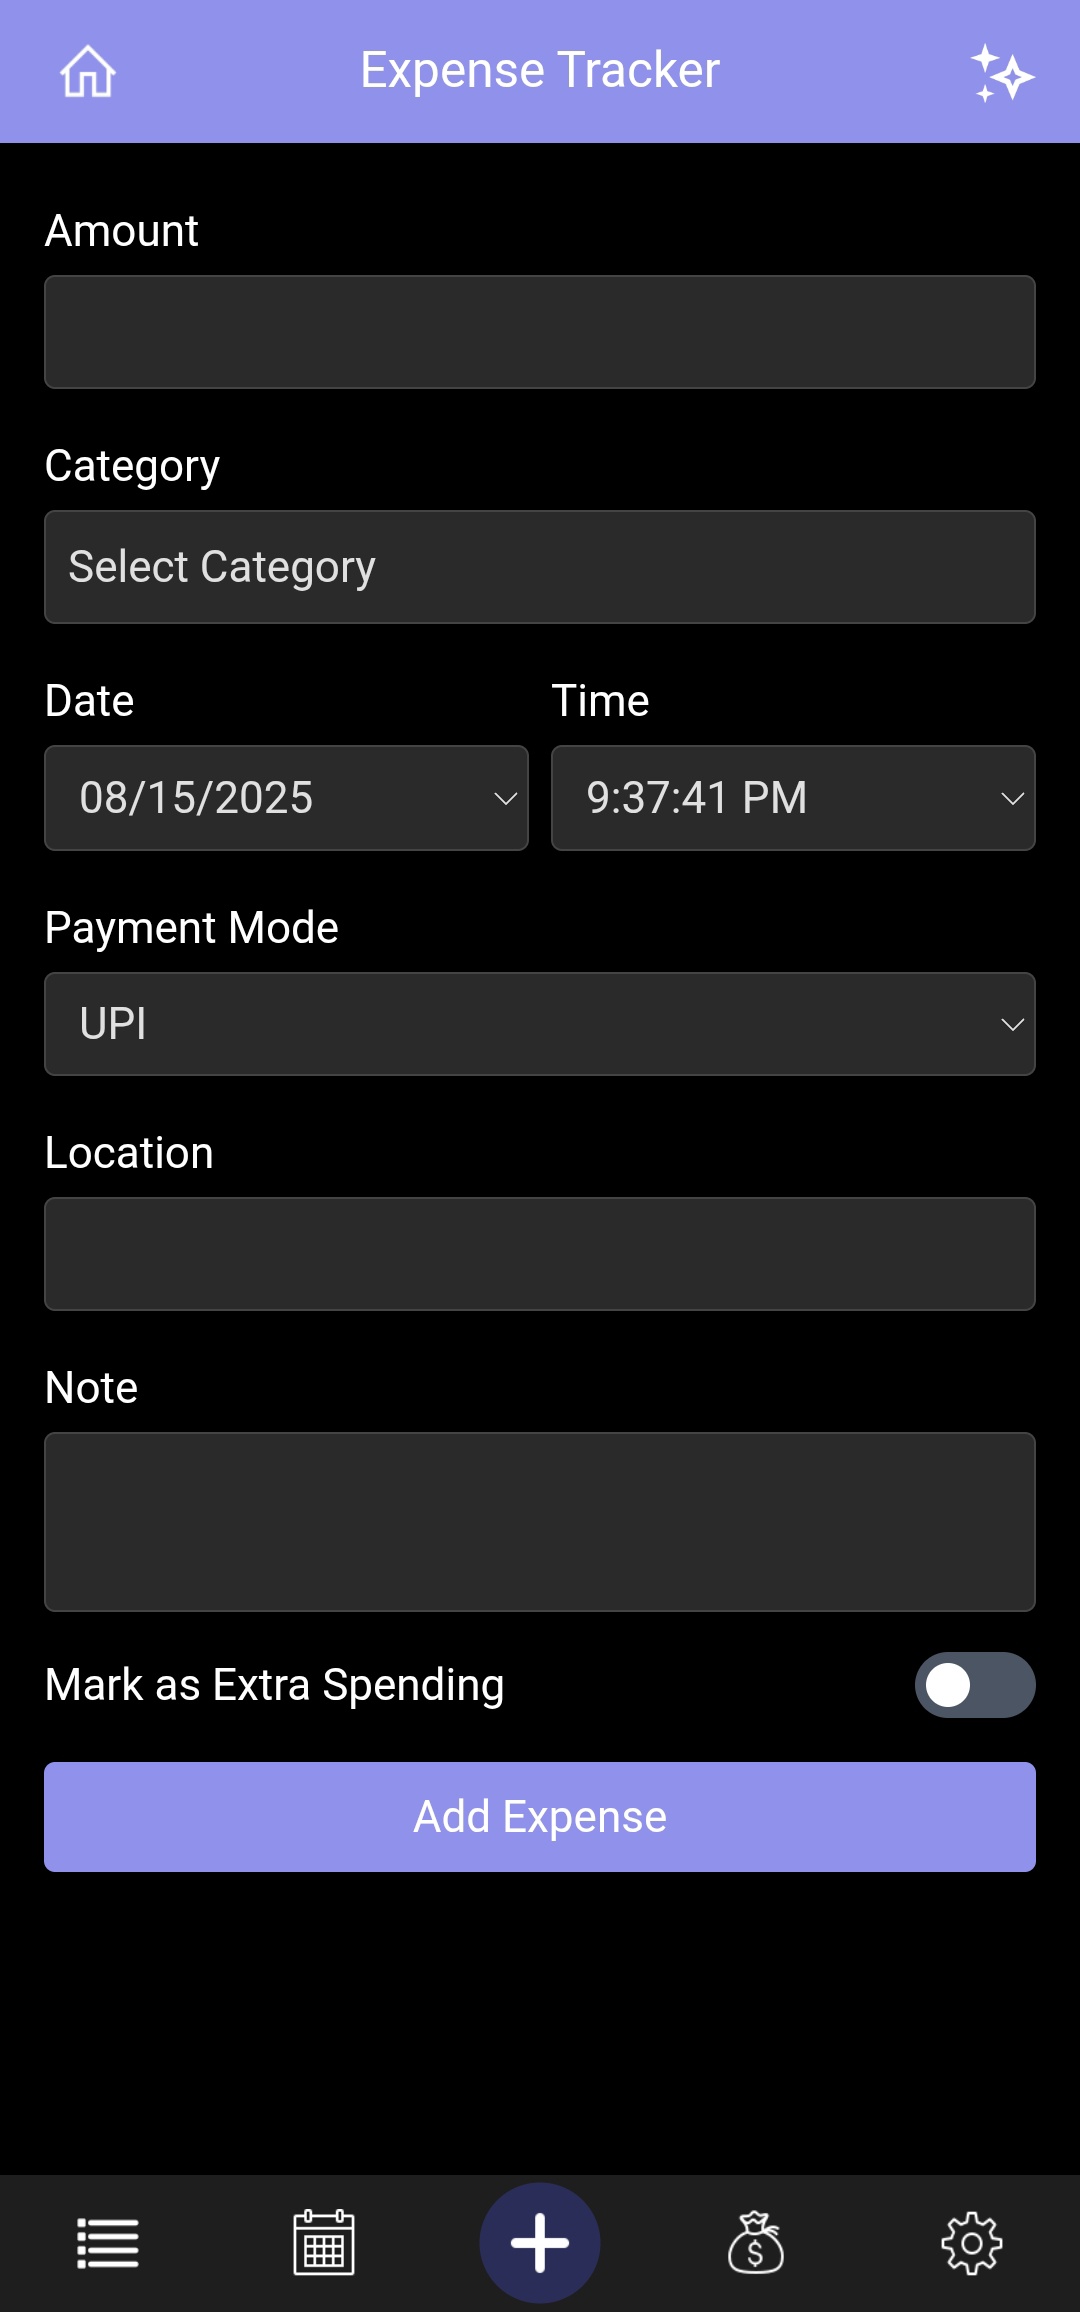
2. Add Expense View
Allows users to add new expense entries through a form. Input fields include:
- 💰 Amount
- 📅 Date & Time
- 🏷️ Category (chosen from a dropdown list)
- 💳 Payment Mode
- 📍 Location (chosen from a dropdown list or manually typed)
- 📝 Note (chosen from a dropdown list or manually typed)
- 💡 Extra Spending
All expenses are stored in the device's LocalStorage and reflected immediately in graphs and listings.
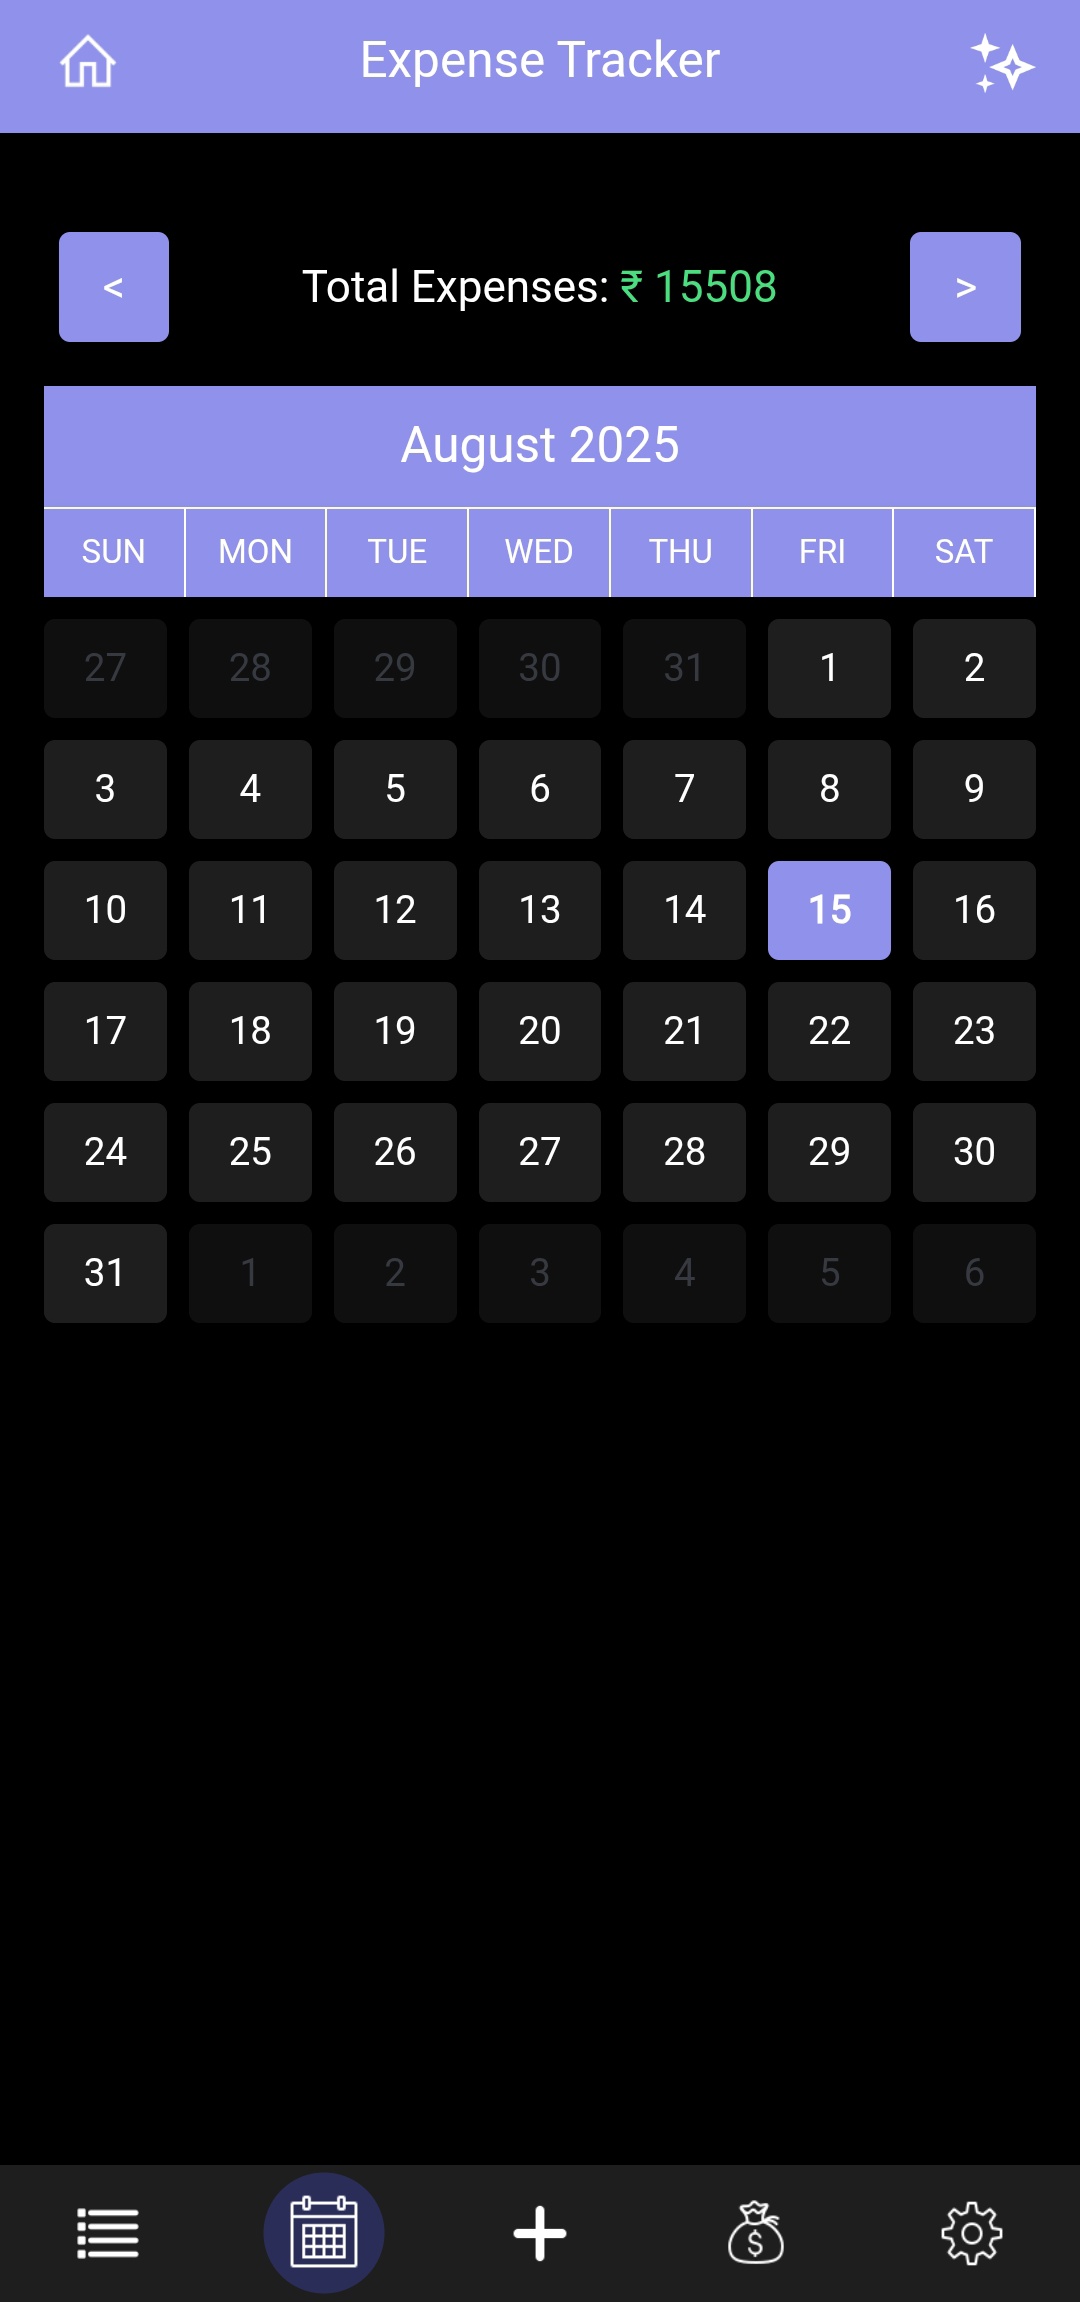
3. Calendar View
- Users can view a monthly calendar to explore expenses on specific dates.
- Tap any date to open a popup modal displaying all expenses for that day.
- Navigate across months and years to view past or future expenses.
- Toggle the Show HeatMap switch to highlight each day based on spending intensity.
- Days are color-coded based on spending thresholds (e.g. No expense, < threshold, between thresholds, > threshold) for quick insights.
- Users can now customize the threshold amounts for each heatmap color:
- Red (Rose) – default > ₹1000
- Yellow (Amber) – default ₹500 - 1000
- Green (Emerald) – default < ₹500
- A summary table displays each color, the number of days, the total expense, and an Edit button for updating the thresholds.
- Editing allows users to set a new amount for the corresponding color, immediately updating the heatmap visualization.
- Additionally, users can enable a radio option to automatically set threshold values based on their budget, where
- Rose represents the average spent per day amount.
- Emerald represents the suggested spending per day amount.
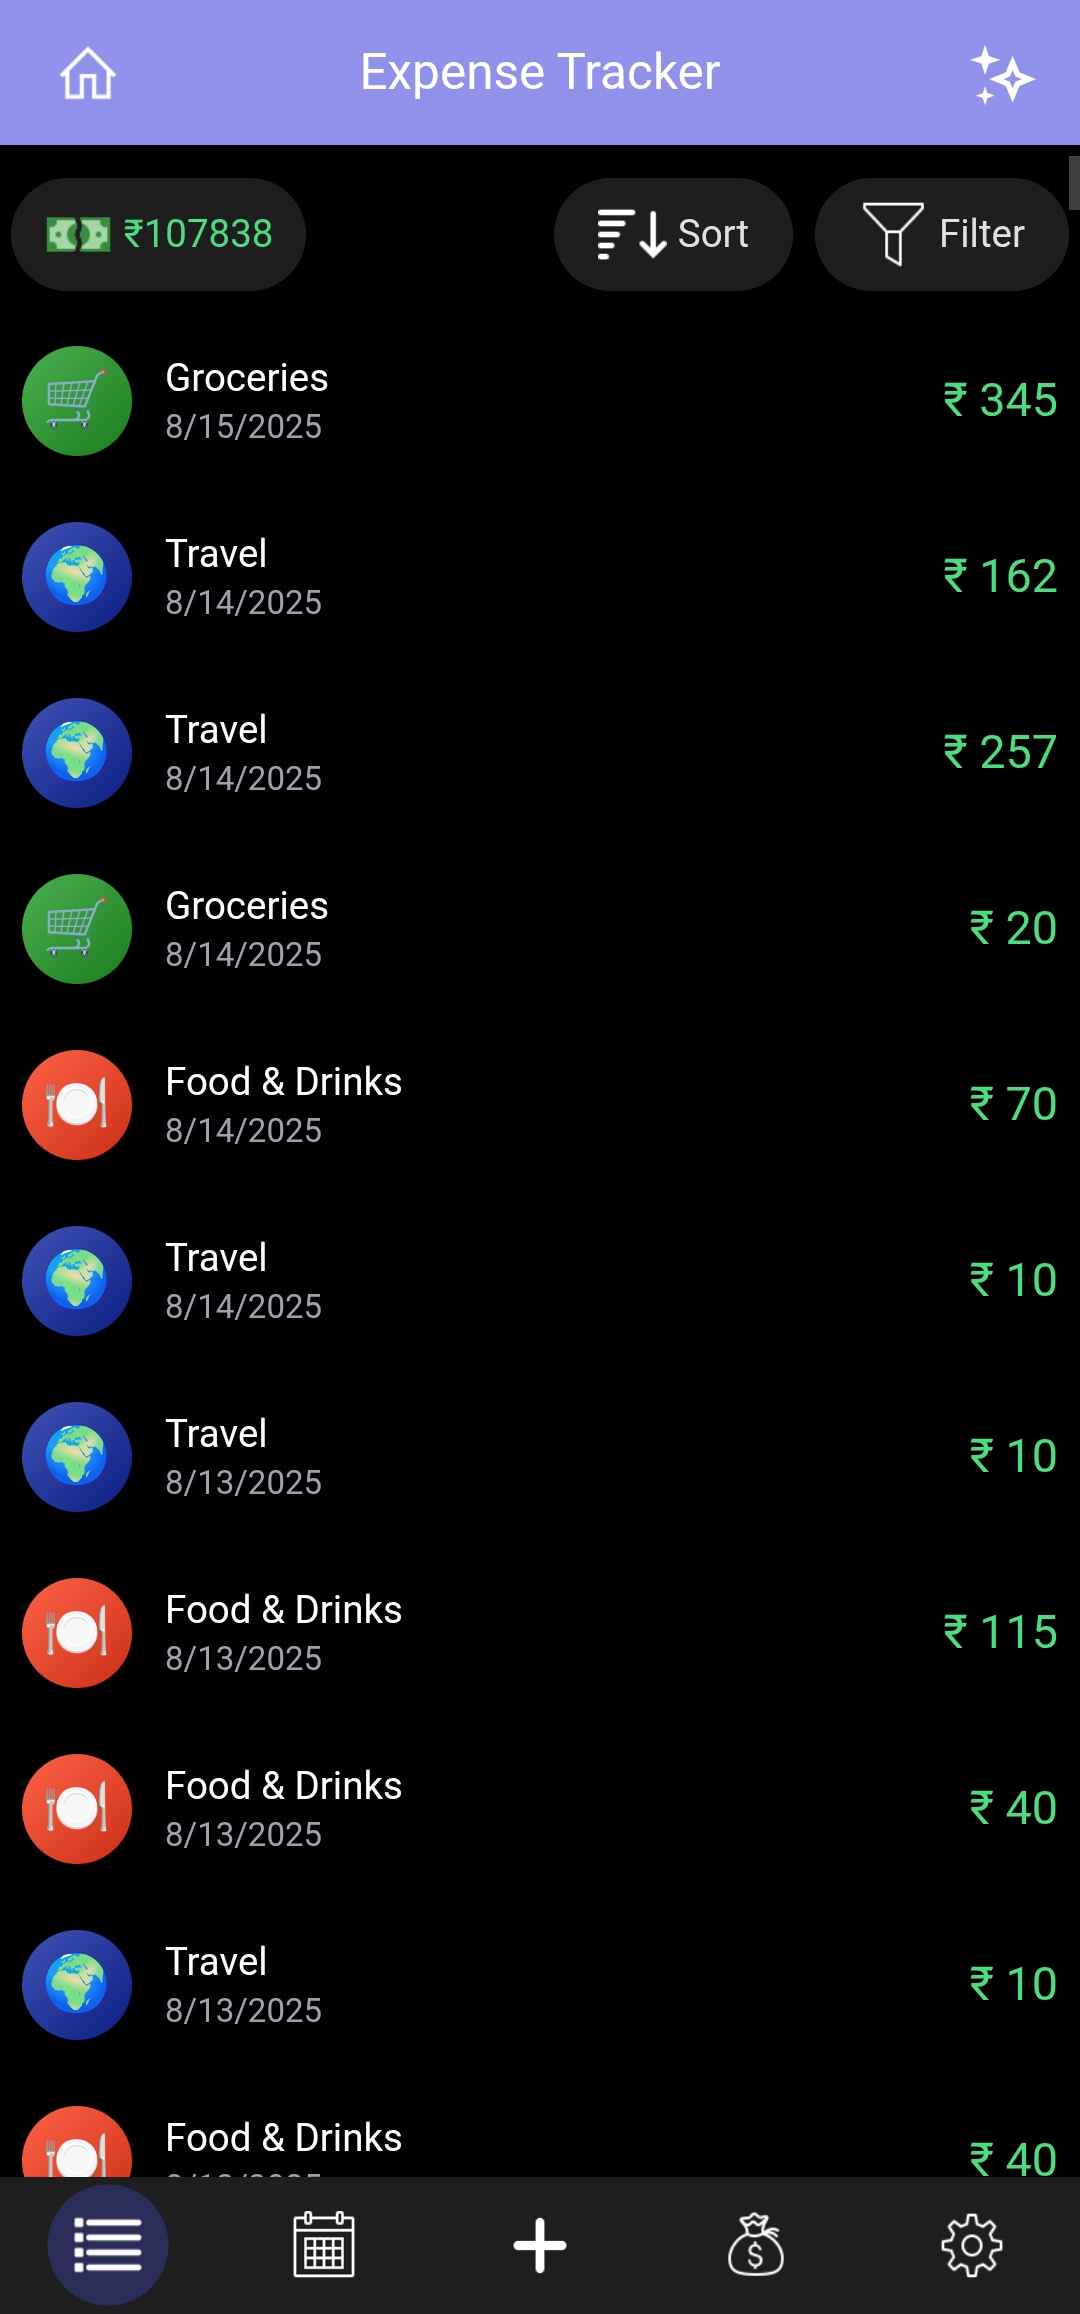
4. List View
Displays all user expenses in a scrollable, and sortable list.
Users can:
- 🔍 Search expenses quickly by typing keywords (category, note, or payment mode).
- 🧾 Sort expenses by date, amount, or category.
- 🎯 Filter by category, date, extra spending, and payment mode.
- 🖱️ Tap any entry to open a modal with complete details and options to edit or delete the expense.
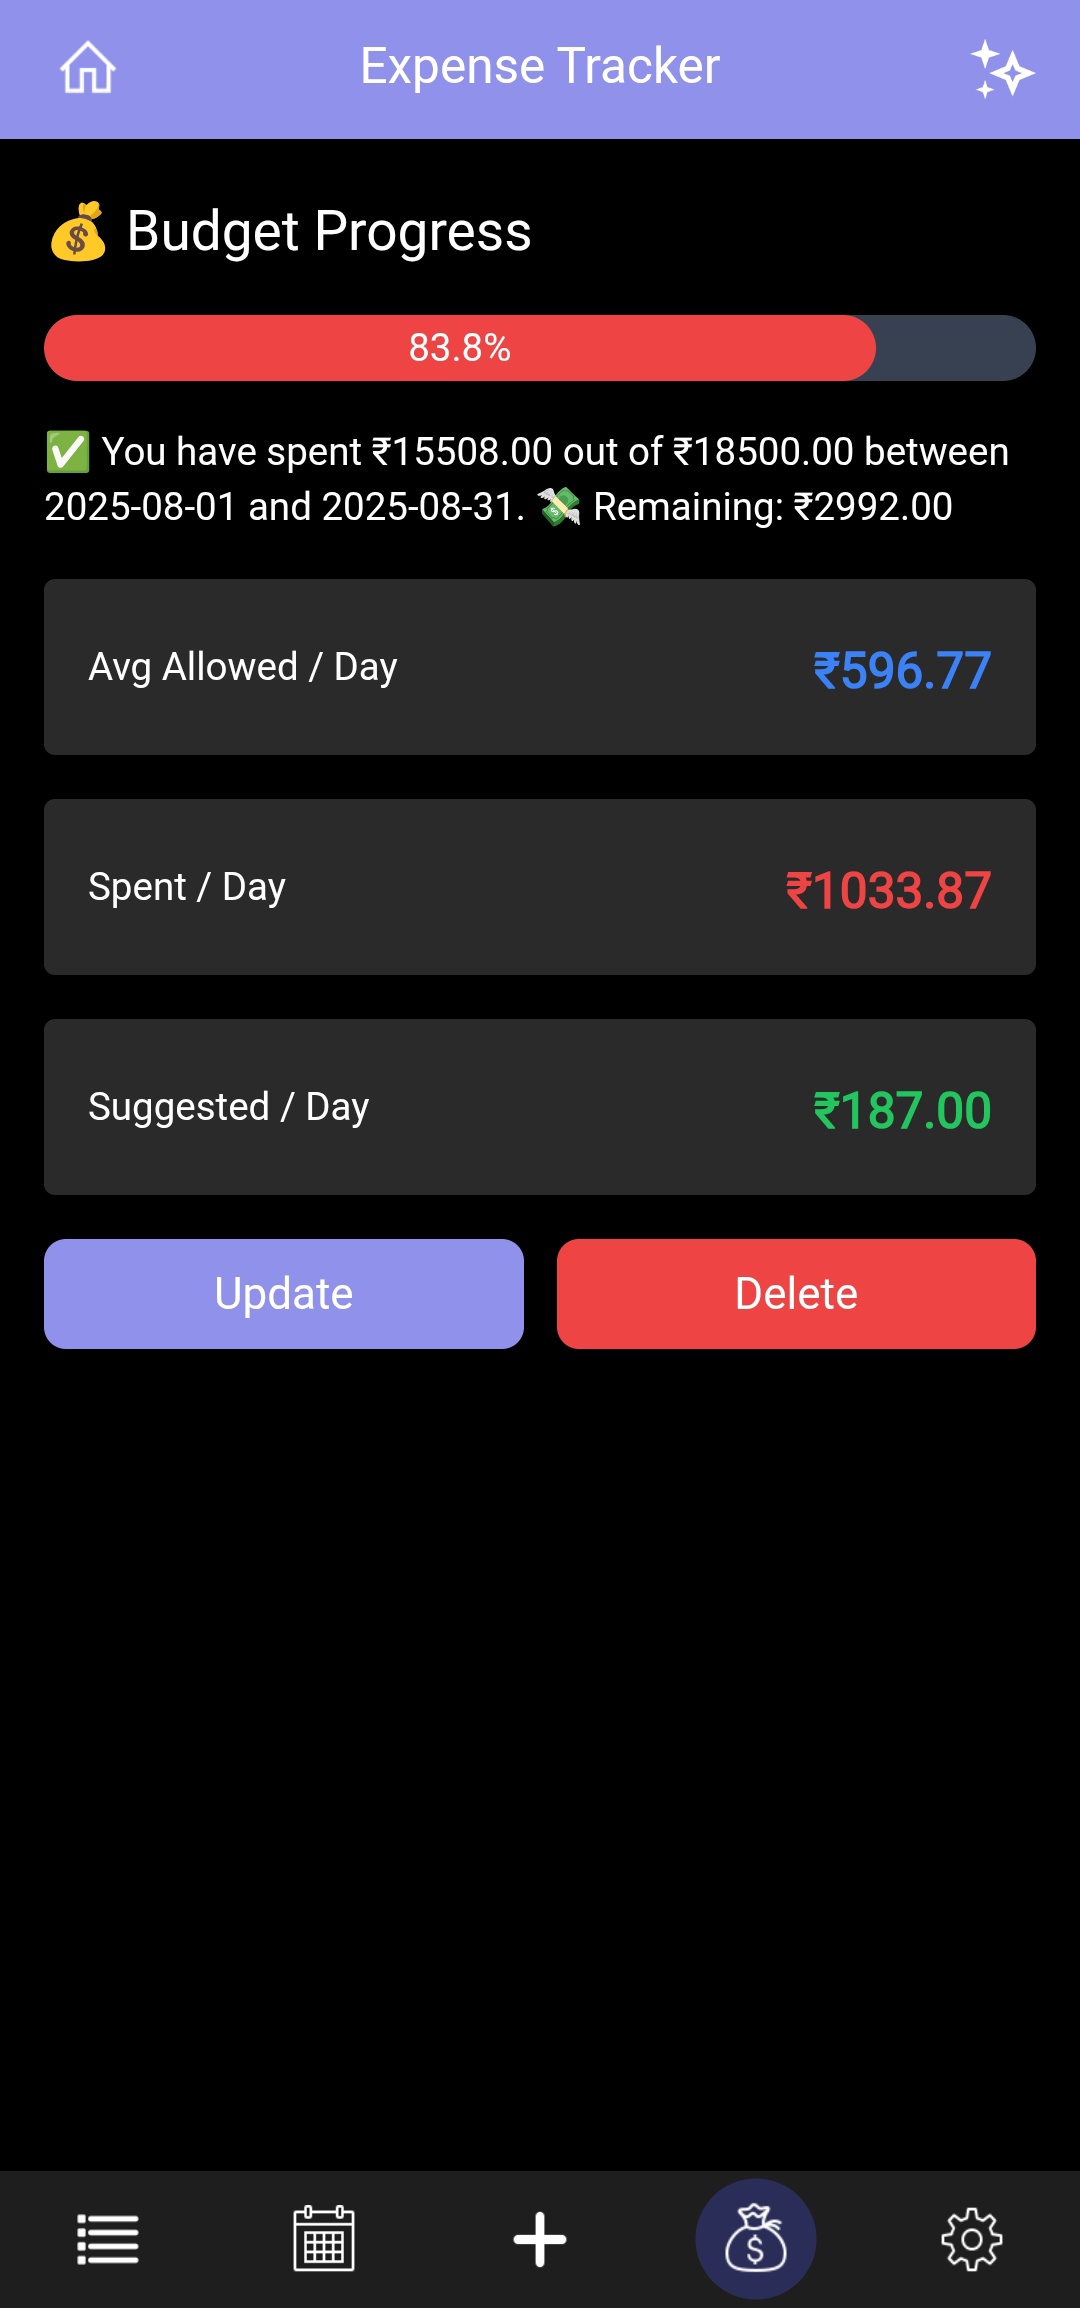
5. Budget & Income Management
The Budget & Income module provides a sophisticated financial dashboard that transitions between total income tracking and granular monthly budgeting, along with advanced filtering capabilities for deeper financial insights.
Key capabilities include:
💼 Dynamic Financial Modes
- Income Tracking: Tracks total accumulated income and overall savings rates.
- Budget Tracking: Focuses on a specific month's limits to prevent overspending.
- The system intelligently calculates metrics based on the active
viewMode.
🔎 Income Date Range Filtering
Users can filter income records between a selected start month and end month.
Displays income analytics based only on the selected period.
Allows better financial analysis such as:
- Tracking income trends over time.
- Reviewing earnings for specific periods.
- Simplifying historical income comparisons.
📊 Advanced Financial Analytics
- Income Growth: Automatically calculates the percentage increase or decrease in income compared to the previous month.
- Savings Rate: Real-time calculation of the percentage of income retained after expenses.
📅 Daily Spending Intelligence
- Allowed/Day: Your theoretical daily limit based on the total budget and days in the month.
- Spent/Day: Actual average spending calculated from the day of your first expense to today.
- Suggested/Day: A dynamic "correction" metric that tells you exactly how much you can spend for the remaining days to stay on target.
🎨 Visual Feedback & Progress
- Smart Progress Bar: A multi-state indicator that shifts colors based on your spending velocity:
- 🟢 Green to Indigo: (Below 50%) – Safe zone.
- 🟠 Orange: (50%–90%) – Warning zone.
- 🔴 Red: (Above 90%) – Critical limit / Exceeded.
- Contextual Status: Text insights (e.g., "Excellent! Saving > 50%" or "⚠️ You have exceeded your limit!").
- Smart Progress Bar: A multi-state indicator that shifts colors based on your spending velocity:
🛠️ Transaction Management
- Full CRUD Operations: Add, edit, and delete income/budget records.
- Validation Layer: Integrated error handling for:
- Maximum amount limits
- Required notes
- Month selection validation
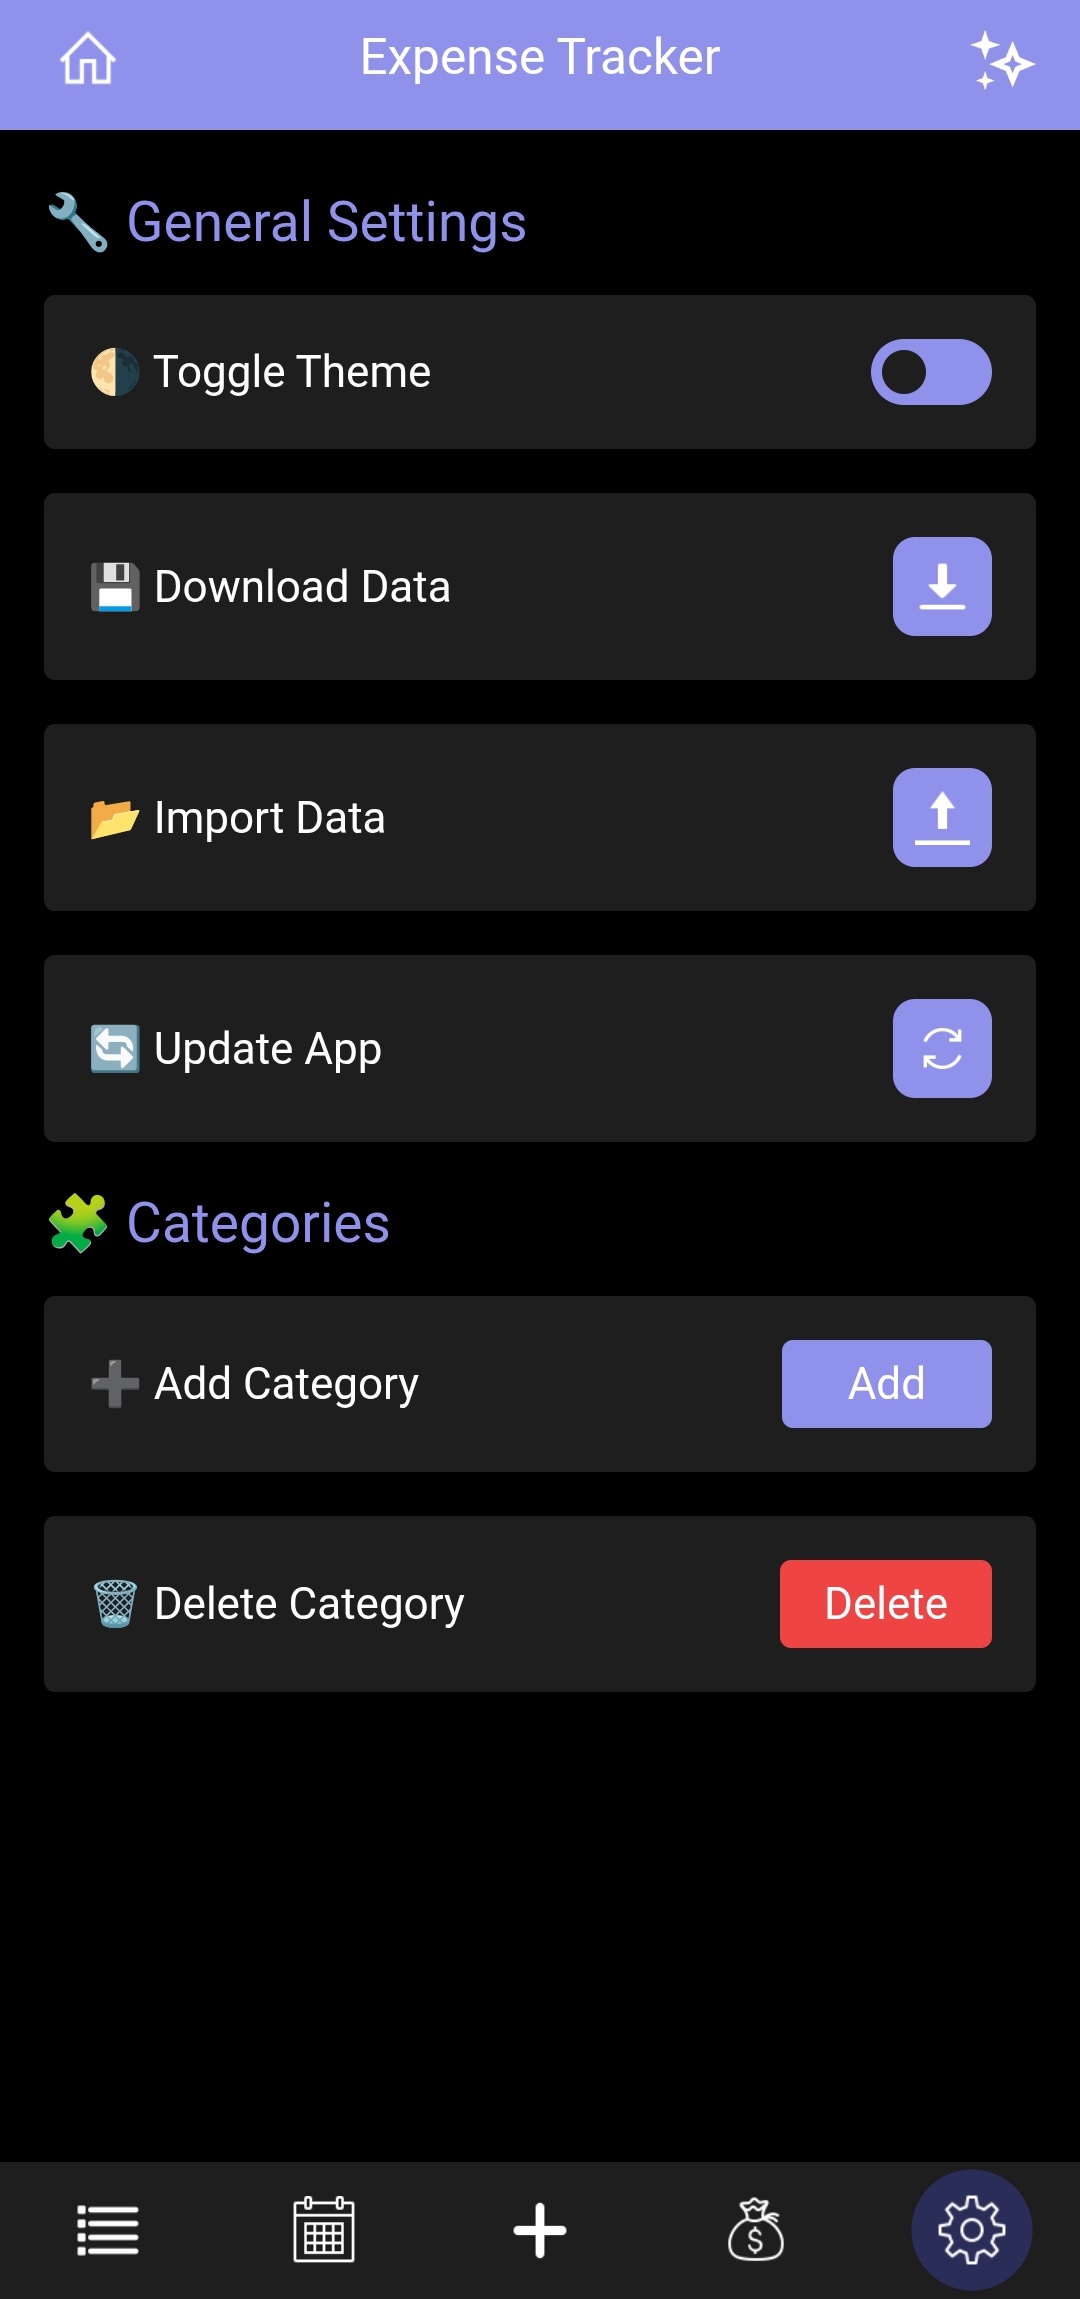
6. Settings View
Provides customization and utility options for better personalization:
- 🎨 Theme Mode Toggle — Switch between Dark and Light modes
- ⬇️ Download Data — Export expenses in PDF, JSON, or Excel formats within a selected date range. Users can also choose All Data to export every expense record
- 📤 Import Data — Upload and import expense data into the application
- 🔄 Update App — Update the application to the latest available version
- ☁️ Data Backup — Enable automatic or manual data backup for data safety. When enabled, a backend API runs automatically in the background to upload your data to the database.
- ❓ Help & Support — Redirects to the external help center for FAQs, guides, and customer support
- ➕ Add Category — Create custom categories for better expense organization
- ✏️ Edit Category — Update or rename existing categories
- ❌ Delete Category — Remove unused or incorrect categories
☁️ 7. Cloud Backup View
The Cloud Backup page provides secure cloud synchronization and backup management for your financial data. This page can be accessed from Settings → Cloud Backup and helps users protect their data against device loss, app reinstall, or accidental deletion.
🔐 Key Features
✅ Auto Backup
- Enables automatic periodic backup of user data to the cloud.
- Once enabled, the app automatically uploads updated data in the background.
- Users can toggle this option anytime.
☁️ Cloud Synchronization
Allows users to manually sync current local data to the cloud.
Useful when:
- You want an instant backup.
- You updated important data recently.
Includes a loading indicator during sync.
🔑 Get Backup Key
Retrieves a secure cloud backup key linked to the user’s stored data.
This key is required to restore data later.
Users can:
- View the key securely in a modal.
- Copy it to clipboard for safekeeping.
⚠️ Important: Keep this key safe. Without it, data restoration may not be possible.
🔄 Restore From Backup Key
Allows users to restore data from the cloud using their backup key.
Process includes:
- Entering the backup key.
- Confirming restoration.
- Automatic replacement of current local data with cloud data.
Includes:
- Data validation before restore.
- Automatic rollback if restoration fails.
🔒 Data Safety Measures
- Backup key–based authentication ensures secure data access.
- Local data is backed up before restore to prevent accidental loss.
- Invalid or corrupted backup data is rejected automatically.
📌 Typical Usage Flow
- Enable Auto Backup for continuous protection.
- Use Sync to Cloud before switching devices.
- Save your Backup Key securely.
- Use Restore from Backup Key when reinstalling or changing devices.
📱 Mobile-First Design
- The application is specifically designed for mobile devices.
- Features responsive components, intuitive touch controls, and visually appealing UI optimized for small screens.
- Not intended for laptop or desktop usage (though it works as PWA).
🗃️ Data Storage
All user data is stored using the browser’s LocalStorage API, ensuring:
- ✅ No need for a backend or server
- ⚡ Fast read/write operations
- 🔒 Data stays on the user's device for privacy and control
📈 User Flow Summary
Launch App → View Expense Graphs (Toggle between Month/Day).
Add Expenses via the ➕ tab.
Navigate to:
- Calendar to view per-date expenses.
- List for detailed log with search, filter, and sort options.
- Budget to monitor spending.
- Settings for customization.
📄 Code Documentation
For developers and contributors, detailed code-level documentation is available here: 👉 Documentation
🖼️ Screenshots